A novel application of hectorite nanoclay for preparation of colorectal cancer spheroids with malignant potential
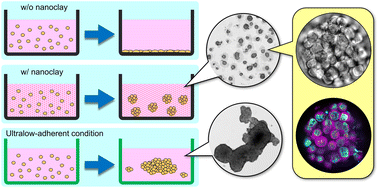
一种利用硅酸镁锂(hectorite)纳米粘土辅助生成恶性潜能更高的结直肠癌细胞球。
Introduction
思路:
体外三维(3D)培养能克服二维(2D)单层培养的很多缺点。细胞球作为多细胞聚集体,被认为更接近于体内肿瘤组织,包括基因表达和药物反应性。此外,癌症干细胞被认为是抗癌药物开发的有希望的靶标,在3D培养中也有保留。
当前的3D培养方法,很少使用无机矿石:
- 有支架的方法,利用了含有细胞外基质蛋白的水凝胶作为支架;
- 无支架的方法,包括超低粘附板、悬滴和搅拌法。
硅酸镁锂是一种属于蒙脱石族的易于合成的粘土矿。合成的硅酸镁锂通常被称为纳米粘土或纳米硅酸盐,因为它具有纳米尺度上的超薄片状层结构,在化妆品、药品和生物医学上具有多种应用。
- 含硅酸镁锂的纳米复合水凝胶可改善人类间充质干细胞(hMSCs)、人类脐静脉内皮细胞、人类肝癌细胞和正常人类皮肤成纤维细胞的增殖;
- 含有浓度为0.005-0.01%的硅酸镁锂的培养基可诱导hMSCs和人脂肪来源的干细胞(hASCs)的成骨分化。
作者表明合成的硅酸镁锂作为一种培养基添加剂对结肠癌细胞的3D培养有用。在粘附板上有效地形成了分散的结肠癌细胞球,且比传统方法制备的细胞球表现出更多的恶性特征。
A unique feature of synthetic hectorite minerals in cell culture

(A)
- i
- ii
- iii
- iv
- v
- vi
(B)
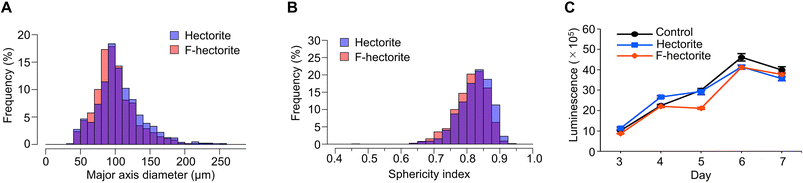
Morphological and proliferative characteristics of spheroids formed by hectorite
- (A)
- (B)
- (C)
Table 1 Summary of quantitative analysis of HT-29 spheroids formed by hectorite minerals
| Concentration | |||
|---|---|---|---|
| 0.005% | 0.01% | 0.02% | 0.04% |
| Number of spheroids used for analysis | ||||
|---|---|---|---|---|
| Hectorite | 1235 | 1270 | 1371 | 1323 |
| F-hectorite | 1143 | 1497 | 1353 | 1286 |
| Major axis diameter (μm)a | ||||
|---|---|---|---|---|
| Hectorite | 100 ± 27 | 101 ± 33 | 94 ± 28 | 87 ± 24 |
| F-hectorite | 97 ± 29 | 96 ± 29 | 94 ± 26 | 81 ± 23 |
| Sphericity indexa | ||||
|---|---|---|---|---|
| Hectorite | 0.85 ± 0.045 | 0.83 ± 0.049 | 0.85 ± 0.050 | 0.87 ± 0.044 |
| F-hectorite | 0.84 ± 0.045 | 0.82 ± 0.049 | 0.81 ± 0.049 | 0.86 ± 0.058 |
a Data are shown as median ± standard deviation.
Optimal concentration of hectorite for spheroid formation

- (A)
- (B)
- (C)
Scanning electron microscopy of spheroids formed using F-hectorite

Localization of hectorite particles within the spheroids

- (A)
- (B)
Molecular biological characteristics of hectorite-induced spheroids

- (A)
- (B)
- (C)
Table 2 Top 30 upregulated genes in F-hectorite spheroids compared with those in control spheroids
| Gene symbol | Description | Fold change | p-Value | FDR p-value |
|---|---|---|---|---|
| FGF19 | Fibroblast growth factor 19 | 11.69 | 6.39 × 10⁻⁸ | 5.02 × 10⁻⁵ |
| TGM2 | Transglutaminase 2 | 8.72 | 2.63 × 10⁻⁶ | 5.38 × 10⁻⁴ |
| XKRX | X-linked Kx blood group related, X-linked | 7.97 | 1.82 × 10⁻⁷ | 1.00 × 10⁻⁴ |
| SEMA3A | Sema domain, immunoglobulin domain (Ig), short basic domain, secreted, (semaphorin) 3A | 5.68 | 4.51 × 10⁻⁸ | 3.87 × 10⁻⁵ |
| SERPINA3 | Serpin peptidase inhibitor, clade A (alpha-1 antiproteinase, antitrypsin), member 3 | 5.65 | 6.14 × 10⁻⁶ | 9.79 × 10⁻⁴ |
| ASIC1 | Acid sensing ion channel 1 | 5.45 | 8.66 × 10⁻⁴ | 2.47 × 10⁻² |
| ENG | Endoglin | 4.99 | 5.53 × 10⁻⁷ | 1.79 × 10⁻⁴ |
| MGAM2 | Maltase-glucoamylase 2 (putative) | 4.89 | 6.79 × 10⁻⁷ | 2.00 × 10⁻⁴ |
| ERMP1 | Endoplasmic reticulum metallopeptidase 1 | 4.79 | 3.47 × 10⁻⁷ | 1.40 × 10⁻⁴ |
| ATP13A2 | ATPase type 13A2 | 4.77 | 4.73 × 10⁻⁶ | 8.06 × 10⁻⁴ |
| ALDH2 | Aldehyde dehydrogenase 2 family (mitochondrial) | 4.71 | 7.12 × 10⁻⁶ | 1.08 × 10⁻³ |
| TEAD2 | TEA domain family member 2 | 4.54 | 5.56 × 10⁻⁶ | 9.12 × 10⁻⁴ |
| LRIG1 | Leucine-rich repeats and immunoglobulin-like domains 1 | 4.54 | 8.21 × 10⁻⁷ | 2.23 × 10⁻⁴ |
| AQP5 | Aquaporin 5 | 4.5 | 1.68 × 10⁻⁵ | 1.79 × 10⁻³ |
| HOXB8 | Homeobox B8 | 4.39 | 1.58 × 10⁻⁴ | 8.26 × 10⁻³ |
| TESC | Tescalcin | 4.34 | 2.60 × 10⁻⁷ | 1.19 × 10⁻⁴ |
| TGFBI | Transforming growth factor, beta-induced, 68 kDa | 4.12 | 3.19 × 10⁻⁶ | 6.06 × 10⁻⁴ |
| ROR1 | Receptor tyrosine kinase-like orphan receptor 1 | 4.05 | 2.99 × 10⁻⁷ | 1.26 × 10⁻⁴ |
| COL9A3 | Collagen, type IX, alpha 3 | 3.98 | 2.52 × 10⁻⁶ | 5.24 × 10⁻⁴ |
| LMO4 | LIM domain only 4 | 3.83 | 1.07 × 10⁻⁶ | 2.68 × 10⁻⁴ |
| CREB3L1 | cAMP responsive element binding protein 3-like 1 | 3.82 | 3.68 × 10⁻⁶ | 6.64 × 10⁻⁴ |
| TGFB2 | Transforming growth factor beta 2 | 3.66 | 6.05 × 10⁻⁵ | 4.42 × 10⁻³ |
| DOCK9 | Dedicator of cytokinesis 9 | 3.66 | 2.52 × 10⁻⁵ | 2.41 × 10⁻³ |
| MMP7 | Matrix metallopeptidase 7 | 3.58 | 3.64 × 10⁻⁵ | 3.10 × 10⁻³ |
| FAM131B | Family with sequence similarity 131, member B | 3.51 | 1.23 × 10⁻⁵ | 1.51 × 10⁻³ |
| ZYX | Zyxin | 3.51 | 1.47 × 10⁻⁶ | 3.39 × 10⁻⁴ |
| PPM1L | Protein phosphatase, Mg2+/Mn2+ dependent, 1 L | 3.46 | 1.03 × 10⁻⁵ | 1.32 × 10⁻³ |
| SEMA3A | Transcript identified by AceView, Entrez Gene ID(s) 10371 | 3.45 | 8.98 × 10⁻⁶ | 1.23 × 10⁻³ |
| DKK1 | Dickkopf WNT signaling pathway inhibitor 1 | 3.41 | 7.65 × 10⁻⁶ | 1.09 × 10⁻³ |
| ANXA9 | Annexin A9 | 3.35 | 6.16 × 10⁻⁶ | 9.79 × 10⁻⁴ |
Enriched gene ontology terms in the DNA microarray dataset of F-hectorite spheroids
Table 3 Top 30 positively enriched gene sets in the gene ontology biological process category in F-hectorite spheroids compared with those in control spheroids
| Accession | GO term | NESa | NOM p-valuea | FDR q-valuea |
|---|---|---|---|---|
| GO:0090175 | Regulation of establishment of planar polarity | 2.11 | 0.000 | 0.036 |
| GO:0032986 | Protein–DNA complex disassembly | 2.08 | 0.000 | 0.030 |
| GO:0031498 | Chromatin disassembly | 2.07 | 0.000 | 0.020 |
| GO:0072673 | Lamellipodium morphogenesis | 2.06 | 0.000 | 0.020 |
| GO:0007431 | Salivary gland development | 2.02 | 0.000 | 0.039 |
| GO:0035019 | Somatic stem cell population maintenance | 2.01 | 0.000 | 0.032 |
| GO:0071526 | Semaphorin–plexin signaling pathway | 2.01 | 0.000 | 0.028 |
| GO:0007164 | Establishment of tissue polarity | 2.01 | 0.000 | 0.026 |
| GO:1900078 | Positive regulation of cellular response to insulin stimulus | 2.00 | 0.000 | 0.028 |
| GO:0035272 | Exocrine system development | 1.99 | 0.000 | 0.028 |
| GO:0035330 | Regulation of hippo signaling | 1.99 | 0.000 | 0.030 |
| GO:0035567 | Non-canonical Wnt signaling pathway | 1.98 | 0.000 | 0.030 |
| GO:0060445 | Branching involved in salivary gland morphogenesis | 1.96 | 0.000 | 0.034 |
| GO:0003401 | Axis elongation | 1.96 | 0.000 | 0.037 |
| GO:0080182 | Histone H3-K4 trimethylation | 1.95 | 0.000 | 0.039 |
| GO:0014033 | Neural crest cell differentiation | 1.92 | 0.000 | 0.052 |
| GO:1900076 | Regulation of cellular response to insulin stimulus | 1.92 | 0.000 | 0.050 |
| GO:0072583 | Clathrin-dependent endocytosis | 1.91 | 0.000 | 0.055 |
| GO:1902285 | Semaphorin–plexin signaling pathway involved in neuron projection guidance | 1.90 | 0.000 | 0.060 |
| GO:0042472 | Inner ear morphogenesis | 1.89 | 0.000 | 0.065 |
| GO:2000737 | Negative regulation of stem cell differentiation | 1.89 | 0.000 | 0.064 |
| GO:0098876 | Vesicle mediated transport to the plasma membrane | 1.89 | 0.000 | 0.061 |
| GO:0014031 | Mesenchymal cell development | 1.88 | 0.000 | 0.059 |
| GO:0055083 | Monovalent inorganic anion homeostasis | 1.88 | 0.002 | 0.060 |
| GO:0050770 | Regulation of axonogenesis | 1.88 | 0.000 | 0.059 |
| GO:0048863 | Stem cell differentiation | 1.87 | 0.000 | 0.060 |
| GO:0001738 | Morphogenesis of a polarized epithelium | 1.86 | 0.000 | 0.071 |
| GO:0048562 | Embryonic organ morphogenesis | 1.86 | 0.000 | 0.069 |
| GO:0007266 | Rho protein signal transduction | 1.85 | 0.000 | 0.067 |
| GO:0060425 | Lung morphogenesis | 1.85 | 0.002 | 0.066 |
a Abbreviations are as follows: NES, normalized enrichment score; NOM p-value, nominal p-value; FDR, false discovery rate.
Table 4 Top 30 positively enriched gene sets in the gene ontology cellular component category in F-hectorite spheroids compared with those in control spheroids
| Accession | GO term | NESa | NOM p-valuea | FDR q-valuea |
|---|---|---|---|---|
| GO:0030027 | Lamellipodium | 2.10 | 0.000 | 0.004 |
| GO:0030140 | trans-Golgi network transport vesicle | 2.04 | 0.000 | 0.010 |
| GO:0032806 | Carboxy-terminal domain protein kinase complex | 2.00 | 0.000 | 0.012 |
| GO:0016514 | SWI/SNF complex | 1.99 | 0.000 | 0.011 |
| GO:0071565 | nBAF complex | 1.98 | 0.000 | 0.010 |
| GO:0030175 | Filopodium | 1.90 | 0.000 | 0.024 |
| GO:0098858 | Actin-based cell projection | 1.90 | 0.000 | 0.021 |
| GO:1904949 | ATPase complex | 1.83 | 0.000 | 0.045 |
| GO:0042641 | Actomyosin | 1.77 | 0.000 | 0.071 |
| GO:0032432 | Actin filament bundle | 1.77 | 0.000 | 0.067 |
| GO:0031527 | Filopodium membrane | 1.76 | 0.013 | 0.063 |
| GO:0005905 | Clathrin-coated pit | 1.75 | 0.002 | 0.066 |
| GO:0031252 | Cell leading edge | 1.70 | 0.000 | 0.098 |
| GO:0030055 | Cell–substrate junction | 1.70 | 0.000 | 0.099 |
| GO:0000145 | Exocyst | 1.69 | 0.012 | 0.095 |
| GO:0043202 | Lysosomal lumen | 1.69 | 0.000 | 0.089 |
| GO:0015629 | Actin cytoskeleton | 1.68 | 0.000 | 0.093 |
| GO:0098839 | Postsynaptic density membrane | 1.67 | 0.002 | 0.098 |
| GO:0031519 | PcG protein complex | 1.67 | 0.007 | 0.094 |
| GO:0005902 | Microvillus | 1.66 | 0.007 | 0.091 |
| GO:0031248 | Protein acetyltransferase complex | 1.65 | 0.002 | 0.099 |
| GO:0032591 | Dendritic spine membrane | 1.63 | 0.020 | 0.108 |
| GO:0035097 | Histone methyltransferase complex | 1.63 | 0.016 | 0.106 |
| GO:0016459 | Myosin complex | 1.61 | 0.007 | 0.126 |
| GO:0030672 | Synaptic vesicle membrane | 1.60 | 0.002 | 0.128 |
| GO:0000124 | SAGA complex | 1.60 | 0.023 | 0.125 |
| GO:0005604 | Basement membrane | 1.59 | 0.005 | 0.131 |
| GO:0005798 | Golgi-associated vesicle | 1.57 | 0.010 | 0.145 |
| GO:0070461 | SAGA-type complex | 1.57 | 0.013 | 0.143 |
| GO:0000118 | Histone deacetylase complex | 1.56 | 0.007 | 0.149 |
a Abbreviations are as follows: NES, normalized enrichment score; NOM p-value, nominal p-value; FDR, false discovery rate.
Table 5 Top 30 positively enriched gene sets in the gene ontology molecular function category in F-hectorite spheroids compared with those in control spheroids
| Accession | GO term | NESa | NOM p-valuea | FDR q-valuea |
|---|---|---|---|---|
| GO:0031491 | Nucleosome binding | 2.11 | 0.000 | 0.008 |
| GO:0050321 | Tau-protein kinase activity | 2.00 | 0.000 | 0.028 |
| GO:0017147 | Wnt-protein binding | 1.97 | 0.000 | 0.030 |
| GO:0031490 | Chromatin DNA binding | 1.96 | 0.000 | 0.027 |
| GO:0019212 | Phosphatase inhibitor activity | 1.92 | 0.000 | 0.037 |
| GO:0001784 | Phosphotyrosine residue binding | 1.86 | 0.002 | 0.075 |
| GO:0030215 | Semaphorin receptor binding | 1.85 | 0.000 | 0.065 |
| GO:0045309 | Protein phosphorylated amino acid binding | 1.83 | 0.000 | 0.073 |
| GO:0031492 | Nucleosomal DNA binding | 1.83 | 0.002 | 0.066 |
| GO:0030276 | Clathrin binding | 1.82 | 0.002 | 0.064 |
| GO:0051015 | Actin filament binding | 1.82 | 0.000 | 0.058 |
| GO:0015026 | Coreceptor activity | 1.81 | 0.000 | 0.063 |
| GO:0003713 | Transcription coactivator activity | 1.80 | 0.000 | 0.072 |
| GO:0005104 | Fibroblast growth factor receptor binding | 1.79 | 0.000 | 0.067 |
| GO:0017081 | Chloride channel regulator activity | 1.79 | 0.004 | 0.069 |
| GO:0001221 | Transcription coregulator binding | 1.79 | 0.000 | 0.065 |
| GO:0140312 | Cargo adaptor activity | 1.78 | 0.006 | 0.066 |
| GO:0070577 | Lysine-acetylated histone binding | 1.77 | 0.002 | 0.069 |
| GO:0042054 | Histone methyltransferase activity | 1.77 | 0.002 | 0.068 |
| GO:0003779 | Actin binding | 1.75 | 0.000 | 0.076 |
| GO:0016811 | Hydrolase activity, acting on carbon nitrogen (but not peptide bonds), in linear amides | 1.75 | 0.002 | 0.074 |
| GO:0008170 | N-Methyltransferase activity | 1.74 | 0.000 | 0.076 |
| GO:0008276 | Protein methyltransferase activity | 1.73 | 0.002 | 0.079 |
| GO:0000146 | Microfilament motor activity | 1.72 | 0.013 | 0.088 |
| GO:0015278 | Calcium-release channel activity | 1.72 | 0.006 | 0.087 |
| GO:0043236 | Laminin binding | 1.71 | 0.008 | 0.086 |
| GO:0035014 | Phosphatidylinositol 3-kinase regulator activity | 1.71 | 0.004 | 0.084 |
| GO:0015108 | Chloride transmembrane transporter activity | 1.69 | 0.009 | 0.100 |
| GO:0050840 | Extracellular matrix binding | 1.69 | 0.009 | 0.100 |
| GO:0015172 | Acidic amino acid transmembrane transporter activity | 1.68 | 0.010 | 0.103 |
a Abbreviations are as follows: NES, normalized enrichment score; NOM p-value, nominal p-value; FDR, false discovery rate.
Discussion
-
Conclusion
Reference
Hirade Y, Kubota M, Kitae K, et al. A novel application of hectorite nanoclay for preparation of colorectal cancer spheroids with malignant potential[J]. Lab on a Chip, 2023, 23(4): 609–623.